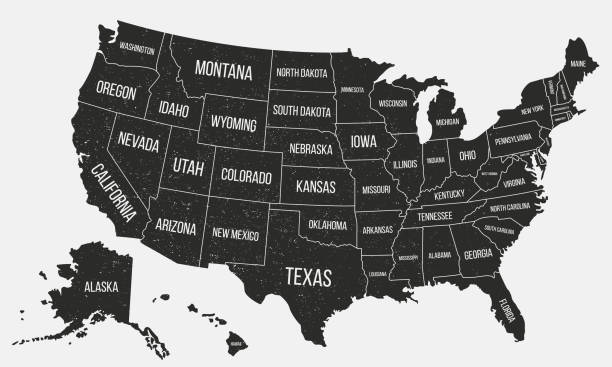
Here Are the States People Moved Into and Out of the Most Last Year

Even during a pandemic . . . or maybe BECAUSE of the pandemic . . . lots of people packed up their stuff and moved to a different state last year.
United Van Lines just released the results of its 44th annual study into moving patterns in the U.S. to figure out which states saw the highest percentage of people moving in . . . and which had the highest percentage of people leaving.
And for the third straight year, New Jersey had the highest ratio of people leaving to people staying . . . 70% of the moves involving New Jersey were outbound.
It was followed by New York . . . Illinois . . . Connecticut . . . California . . . Kansas . . . North Dakota . . . Massachusetts . . . Ohio . . . and Maryland.
On the other side of things, Idaho had the highest ratio of people moving in to moving out . . . 70% of the moves involving Idaho were inbound. So literally the opposite ratio of New Jersey.
Right after Idaho was: South Carolina . . . Oregon . . . South Dakota . . . Arizona . . . North Carolina . . . Tennessee . . . Alabama . . . Florida . . . and Arkansas.
(Here are the stats for every state.)
You Might Also Like


